Overview
The US economy grew slower than expected in the first three months of 2024, as exports and consumer spending fell, supporting financial markets’ predictions that the Federal Reserve would postpone rate cuts until September. The likelihood of weaker growth and more stubborn inflation has increased the Fed’s reliance on data.
The International Monetary Fund (IMF) increased its forecast for US GDP in 2024 to 2.7% from 2.1% in January, citing stronger-than-expected employment and consumer expenditure. The year-over-year growth in the personal consumption expenditures (PCE) price index, which the US central bank targets at 2%, increased to 2.7% in March, up from 2.5% in February. Core PCE, a measure of underlying inflation, came in at 2.8%, unchanged from February.
Fed’s Dot Plot Game
The most recent dot plot, released on March 20, revealed that most Fed leaders expect the benchmark rate to fall from nearly 5.5 percent to less than 4.75 percent by December 31. In other words: three 25-basis-point rate cuts. The difficulty, of course, is that the most recent inflation data conflicts with this projection. The dot plot confuses markets rather than directing them. Mr. Powell has recently stated that the Fed is in a wait-and-see mode on interest rates,but the dot plot still indicates it is about to lower. If the Fed does not lower interest rates this year or cut them less than other G10 central banks, the USD will become much stronger, causing problems globally and particularly in emerging countries. Interest rate differentials can be uncomfortable.
Markets anticipate fewer rate cuts this year compared to the Fed’s dot plot prediction of three rate reductions by year-end. The expected fed funds rate for December has risen to 5.0%, indicating that the futures market expects only one to two rate decreases. We can expect a downward adjustment to the Fed Dot Plot during the June meeting, would postpone rate cuts until September. The likelihood of weaker growth and more stubborn inflation has increased the Fed’s reliance on data.
Dollar’s technical outlook
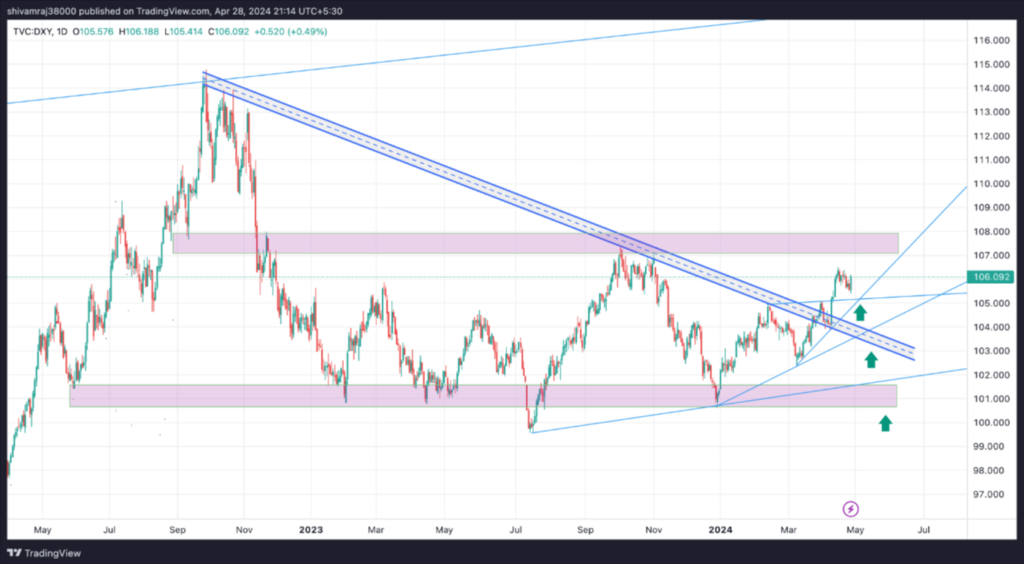
The US Dollar Index (DXY) which measures the value of the US currency against six major counterparts, was up 0.49% to 106.09 last Friday. Since September 2023, the index has followed a more or less sideways pattern. It is currently demonstrating a positive tone and has the potential to reach resistance levels of 107–108. The essential thing to bear in mind is that the US currency is inflating at a 7% annual rate. The index is in buy-on-dip mode, which means that if it experiences a minor pullback and then resumes its bullish trend, the 105 level could be its first stopping. A return to 102-103 can prove to be a strong buying mark, and we should expect a significant rally from there.
Dollar Index daily chart


